Introduction:
In the bustling tech hub of Bangalore, Vagdevi Technologies stands tall as a beacon of innovation and efficiency. At the heart of their data-driven approach lies Power BI, Microsoft’s powerful business analytics tool. In this blog, we delve into the world of Power BI at Vagdevi Technologies, exploring its core features, applications, and impact on decision-making processes.
Power BI Overview:
Power BI is more than just a reporting tool; it’s a comprehensive suite of business analytics tools that enables organizations to visualize data, share insights, and make informed decisions. At Vagdevi Technologies, Power BI serves as the backbone of their data strategy, empowering teams across departments to extract actionable insights from complex datasets.
Power BI Desktop:
Power BI Desktop is the starting point for most data analysis tasks at Vagdevi Technologies. This intuitive desktop application allows users to connect to various data sources, transform raw data into meaningful insights using Power Query, and create interactive reports and dashboards with drag-and-drop simplicity. Its seamless integration with other Microsoft products makes it a preferred choice for data analysts and business users alike.
Data Analysis Expressions (DAX):
Data Analysis Expressions (DAX) is the language of Power BI, enabling users to create custom calculations, manipulate data, and perform advanced analytics. At Vagdevi Technologies, DAX plays a crucial role in unlocking the full potential of their data, allowing analysts to derive key performance indicators (KPIs), forecast trends, and gain deeper insights into business metrics.
Data Visualizations:
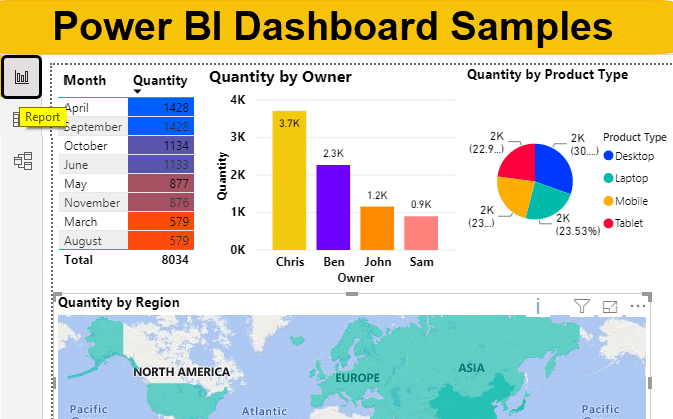
Visualizing data is essential for effective communication and decision-making. With Power BI’s rich collection of visualization tools, Vagdevi Technologies transforms raw data into interactive charts, graphs, and maps that tell compelling stories. From simple bar charts to complex geographical heatmaps, Power BI’s visualization capabilities cater to diverse analytical needs, ensuring that insights are conveyed clearly and intuitively.
Power BI Q&A and Data Insights:
One of the standout features of Power BI is its natural language querying capability, known as Power BI Q&A. At Vagdevi Technologies, this feature empowers users to ask questions about their data in plain language and receive instant answers in the form of interactive visualizations. This democratization of data access fosters a culture of curiosity and data-driven decision-making across the organization.
Power BI Report Server:
For organizations that require on-premises reporting and data visualization capabilities, Power BI Report Server offers a flexible solution. At Vagdevi Technologies, the Report Server enables secure distribution of Power BI reports within the company’s infrastructure, ensuring compliance with data governance policies and regulatory requirements.
Conclusion:
As we conclude our journey through the realm of Power BI at Vagdevi Technologies, it’s evident that this powerful tool has revolutionized the way data is analyzed, interpreted, and acted upon. From its user-friendly interface to its advanced analytics capabilities, Power BI has become an indispensable asset for driving innovation and informed decision-making in the dynamic landscape of modern business. As Vagdevi Technologies continues to harness the power of data, the possibilities are limitless, paving the way for a future fueled by insights and intelligence.


